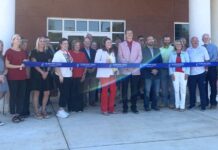






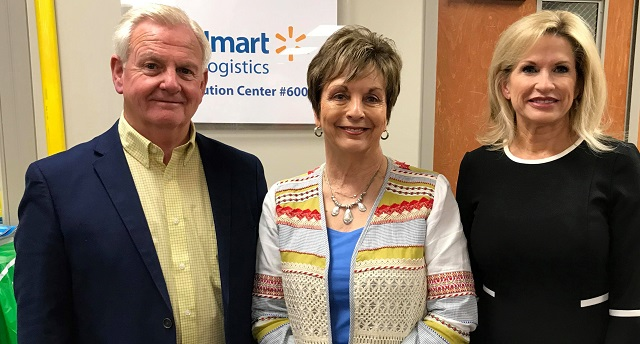
CULLMAN, Ala. – The Tribune sat down last week with representatives of the Cullman Area Chamber of Commerce and auditors who recently completed an audit of the Chamber for the period between March 2019 and February 2020. The Chamber’s Interim President and CEO Peggy Smith, Chamber Chair Kay Shabel, Vice Chair Jeff Tolbert and Board Member Shane Quick talked about what the Chamber has been doing, while Warren Averett auditors Charles Eddy and Mark Hestla described the audit.
Eddy said that he found nothing wrong during the audit, telling The Tribune, “I’ve worked with the Chamber personally for over 20 years. We’ve seen a lot of things, and the thing that I’ve seen in the last seven or eight years is tremendous growth with revenue and services.”
He commended the resiliency of the Chamber during current pandemic conditions and added, “Peggy’s leadership has brought a lot of stability and better communication throughout the community. I think Kay’s leadership has really brought the same, so I think it helps to have people like that, that have been around a time or two.”
Recent Chamber highlights
- County Road 222/Interstate 65 interchange project, in cooperation with the City of Cullman, Cullman County and the City of Good Hope. The interchange did not lead to the Bass Anglers’ Hall of Fame, as hoped, but did create a new point of interstate access to Smith Lake and one of Cullman’s industrial development areas.
- Housing study. The study, a cooperative effort between multiple political, educational, business and community entities, examined Cullman area demographics to determine housing needs, encourage development of appropriate housing to meet those needs and encourage developers to invest in the Cullman area. The study has gained national attention. The report can be viewed at www.cullmanchamber.org/housing-taskforce/.
- Smith Lake FLW fishing tournament. The tournament was based in Jasper but has been relocated to Cullman. The event, another cooperative effort between City, County and Chamber, could bring up to a 10-to-1 return on the money Cullman puts into it. The FLW approached Cullman with the idea of moving the tournament and offered $60,000 per year for two years. According to Tolbert, general manager of Trident Marina, “They said, ‘We like the amenities that Cullman’s got: you’ve got more hotels, you’ve got more restaurants, you’ve got a-’ thanks to the County and the expenditures they made at the park, and they actually hired an outside consulting firm approved by the state to come in and design the boat ramp to be able to handle- I mean, the issue is not necessarily can you launch 250 boats, it’s where you’re going to park 250 vehicles with trailers.”
- The Chamber was commended for financial transparency. According to Shabel, Jeremy Arthur, president of the Chamber of Commerce Association of Alabama, commended the Chamber on its public posting of financial documents.
- Smith said in a note to The Tribune, “As a nationally-ranked chamber of commerce, we speak to many chamber leaders throughout the nation. Our chamber has been commended for our transparency for things like posting our IRS Form 990 online, our financial review, and now, our audit report. We are not a public entity like a city or a county, but we recognize that lodging tax revenue is public money that requires a great level of accountability. Our goal in requesting this audit and sharing its results is to be more transparent than is required for a 501(c)(6) agency. We are grateful for our partnerships with the city and county leaders. Their presence as stakeholders is essential, and their direction and guidance help to ensure the Cullman Area Chamber of Commerce continues to serve our community while being recognized as one of the best Chambers in the country.”
- The Chamber was ranked fourth in the country in the last year.
Numbers
Note: The Chamber’s fiscal year (FY) runs from March 1 until the last day of the following February. The numbers for FY 2015-18 were taken from documents that are publicly available on the Chamber website at www.cullmanchamber.org/financials/. The 2019-20 audit period ended Feb. 29, 2020 and so does not reflect the recent impact of COVID-19 and its accompanying economic shutdown that has impacted industry, business and tourism in the Cullman area since March.
Sources:
FY 2015 and 2016 – IRS Form 990 filed in 2017
FY 2017 – IRS Form 990 filed in 2018
FY 2018 – financial review by Warren Averett CPAs and Advisors in 2019
The FY 2019 numbers are those reported in the 2020 Warren Averett audit.
IRS tax forms for 2018 and 2019, which contain certain details not found in the Warren Averett documents, were not made available. Only the review and audit documents were posted.
Total Revenues
2015 – $903,631
2016 – $935,746
2017 – $1,122,432
2018 – $1,129,149
2019 (audit) – $1,348,260
Despite shakeups at the Chamber in 2019, income for the agency continued its steady upward trend.
Total Expenses
2015 – $801,161
2016 – $1,020,745
2017 – $1,043,015
2018 – $1,043,015 (The same amount was given in separate documents for both 2017 and 2018.)
2019 (audit) – $1,393,032
Expenses, like revenues, have seen an upward trend, leaving the Chamber with two years- including the most recent- in which it saw a loss on expenses v. revenues.
Net of Revenues v. Expenses (+positive, -negative/loss)
2015 – (+)$102,470
2016 – (-)$84,999
2017 – (+)$79,417
2018 – (+)$86,134
2019 (audit) – (-)$44,772
Membership Dues
2015 – not available
2016 – $221,271
2017 – $204,936
2018 – $196,558
2019 (audit) – $206,692
Income from memberships appears unaffected by the 2019 shakeup.
Salaries
2015 – $310,181
2016 – $322,790
2017 – $426,634 (reported in 2018 financial review as $394,658)
2018 – $485,162
2019 (audit) – $398,386 (includes benefits)
The sharp drop in salary costs was caused by a substantial decrease in the size of the Chamber staff. Numbers for 2018 were not available, but from 2017 to February 2020, the staff shrank from 17 to six.
Number of Employees
2015 – not available
2016 – 11
2017 – 17
2018 – not available
2019 (audit) – Not available. Smith reported separately that the Chamber had a peak of nine employees during the audit period, and six at the conclusion of the period.
Officer/Director/Key Employee Compensation
2015 – not available
2016 – $76,034 (all specified as then CEO Leah Bolin’s salary)
2017 – $96,598 (all specified as Bolin’s salary)
2018 – Not available
2019 (audit) – Not available, but the Chamber reported separately that Bolin was receiving, at the time of her departure, an annual salary of $85,000, and received a severance payment of $24,519.30, equivalent to 15 weeks of that salary. Though she received severance pay, Bolin’s 2019 departure was announced by the Chamber as a resignation.
According to Smith, “Leah Bolin’s severance was calculated using the federal guidelines 5 U.S.C. 5595 and 5 CFR part 550. It was a fair and equitable package for the years and service she provided to the Chamber during her time as CEO.”
Advertising Expenditures
2015 – not available
2016 – $25,563 total (listed on Form 990 as “Advertising and promotion”)
2017 – $18,333 total (listed on Form 990 as “Advertising and promotion”)
2018 – $3,156 (listed in review documents as “Advertising”)
2019 (audit) – $6,848 (listed in audit documents as “Advertising”)
Advertising expenses may be counted differently between the tax documents and the review and audit documents but, as the 2018 and 2019 tax documents were not made available, no comparison could be made.
End of Year Final Net Assets/Fund Balances
2015 – $854,986
2016 – $769,987
2017 – $849,404
2018 – $800,173
2019 (audit) – $747,063
The last several years have seen a gradual decline in fund balances with a substantial drop in 2019.
From the 2018/19 financial review to the 2019/20 audit
Numerous areas of the budget saw steady declines from 2018 to February 2020. One positive point in that trend is the decreasing long-term debt. Program and event revenues, which saw a spike from early 2018 to February 2019, saw a sharp drop coming into 2020, even before COVID-19 began forcing wholesale event cancellations.
Cash and cash equivalents on hand
2018 . . . . . . . . . . . . . . . . . $362,016
As of Feb. 28, 2019 . . . . . $338,353
As of Feb. 29, 2020 . . . . . $235,046
Members and other accounts receivable (mainly member dues and campaign revenues)
2018 . . . . . . . . . . . . . . . . . $167,756
As of Feb. 28, 2019 . . . . . $93,511
As of Feb. 29, 2020 . . . . . $80,223
Net value of property and equipment (will tend to decrease due to depreciation)
2018 . . . . . . . . . . . . . . . . . $890,101
As of Feb. 28, 2019 . . . . . $831,765
As of Feb. 29, 2020 . . . . . $772,951
Total assets
2018 . . . . . . . . . . . . . . . . . $1,550,496
As of Feb. 28, 2019 . . . . . $1,390,920
As of Feb. 29, 2020 . . . . . $1,177,181
Long-term debt
2018 . . . . . . . . . . . . . . . . . $282,206
As of Feb. 28, 2019 . . . . . $228.318
As of Feb. 29, 2020 . . . . . $221,301
Assets without donor restrictions
According to the audit report, “Revenue from membership dues and programs and events are classified as net assets without donor restrictions for financial statement purposes.”
2018 . . . . . . . . . . . . . . . . . $623,135
As of Feb. 28, 2019 . . . . . $578,363
As of Feb. 29, 2020 . . . . . $532,491
Assets with donor restrictions
According to the audit report, “Net Assets with Donor Restrictions primarily consist of lodging tax receipts whose use by the Chamber have been limited by legislation to a specific purpose.”
2018 . . . . . . . . . . . . . . . . . $226,269
As of Feb. 28, 2019 . . . . . $221,810
As of Feb. 29, 2020 . . . . . $214,572
Revenues from programs and events
2018 . . . . . . . . . . . . . . . . . $464,578
As of Feb. 28, 2019 . . . . . $634,447
As of Feb. 29, 2020 . . . . . $450,074
Expenditures on programs and events
2018 . . . . . . . . . . . . . . . . . $302,040 (more made than spent)
As of Feb. 28, 2019 . . . . . $481,468 (more made than spent)
As of Feb. 29, 2020 . . . . . $476,117 ($26,043 more spent than made)
Quick said about the 2020 reported loss, “One number you’re not able to see that makes it well worth it is the economic impact these events make on the Warehouse District,” noting that while the Chamber may lose money on some events, those events give local businesses that make up the Chamber an opportunity for increased profits. Shabel said that the purpose of the programs and events is not to generate income for the Chamber, though the body does want to break even whenever possible.
Advertising expenditures
2018 . . . . . . . . . . . . . . . . . $3,156 (all spent in tourism)
As of Feb. 28, 2019 . . . . . $3,027 (all spent in tourism)
As of Feb. 29, 2020 . . . . . $6,848 ($4,860 general, $496 tourism, $1,492 economic development)
Advertising has, contrary to the overall trend, seen a sharp rise, though advertising specific to tourism has dropped drastically.
Lodging tax receipts
2018 . . . . . . . . . . . . . . . . . $453,267
As of Feb. 28, 2019 . . . . . $512,276
Not specified, but the 2018 and 2019 amounts reflect levels after disbursement for 222 interchange project.
As of Feb. 29, 2020 . . . . . $692,690 total; $505,975 after disbursement for 222 interchange project and other adjustments.
Lodging tax revenues were slightly down from the previous year, but not heavily impacted before the arrival of COVID-19.
About the lodging tax, the audit report reads, “The proceeds of the 5% lodging tax levied by the State of Alabama Legislature are remitted to the Chamber by the Cullman County Commission. The Chamber will use 40% of the proceeds for the purpose of developing and promoting tourism and conventions, and 20% will be used for economic and industrial development purposes in the county. The Chamber recognizes these receipts as donor restricted net assets when they are received from the Cullman County Commission. The remaining 40% is to be used as follows: 30% of the remaining amount will be used for the purpose of developing and promoting tourist attractions and events in the county, and 70% is designated to fund debt entered into by the Cullman County Commission in order to fund the 222 Interchange Project. The Chamber entered into an agreement with the Cullman County Commission to help fund the 222 Interchange Project during fiscal year 2014. In 2020, the Chamber received $692,690 in lodging tax receipts, of which $193,953 was remitted to fund the 222 Interchange Projects debt. The Chamber’s obligation began on March 1, 2013 and will cease March 1, 2023. In the event the loan is paid in full prior to the maturity date of the ten-year period, the monthly distributions required from the Chamber of Commerce for this project will cease.”
Change in net assets (+positive, -negative/loss)
2018 . . . . . . . . . . . . . . . . . (+)$79,417
As of Feb. 28, 2019 . . . . . (-)$49,231
As of Feb. 29, 2020 . . . . . (-)$53,110
For two years, net assets have represented a loss for the Chamber.
General Fund expenses
2018 . . . . . . . . . . . . . . . . . $555,220
As of Feb. 28, 2019 . . . . . $581,052
As of Feb. 29, 2020 . . . . . $458,354
Tourism Program expenses
2018 . . . . . . . . . . . . . . . . . $214,604
As of Feb. 28, 2019 . . . . . $242,790
As of Feb. 29, 2020 . . . . . $273,502
Tourism program expenditures have certainly defied the downward trend, rising steadily and quickly.
Economic Development Program expenses
2018 . . . . . . . . . . . . . . . . . $273,191
As of Feb. 28, 2019 . . . . . $569,190
As of Feb. 29, 2020 . . . . . $477,555
Financial assets available to meet cash needs for general expenditures
2018 . . . . . . . . . . . . . . . . . $376,371
As of Feb. 28, 2019 . . . . . $283,102
As of Feb. 29, 2020 . . . . . $174,052
“Cash on hand” assets have seen a steep decline to less than half of what they were in early 2018.
Copyright 2020 Humble Roots, LLC. All Rights Reserved.